Visualize data
Make your location data come to life. See complex trends and patterns by creating intuitive visualizations.
Enhance your business decisions with new insights
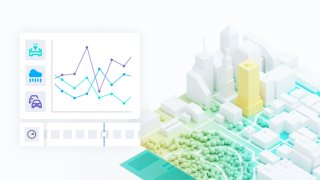
Visualizing real world data on a map is an essential way of identifying and understanding emerging trends and patterns. Thanks to our intuitive no-code/low-code tools, anyone can use our cutting-edge algorithms to process large data sets. Discover how HERE can help you find relevant data sources, build data models and define data pipelines to create 2D or 3D custom maps.
Explore, view, style and edit your data
Map Data Visualization, Map Data, Location Data
Visualize your data on a map
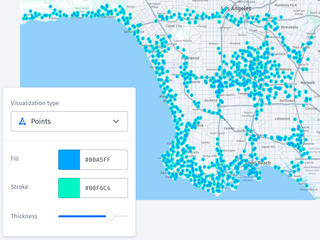
Easily create impactful maps using data-driven styling. Design your visualization with custom markers, colors and stylistic elements, such as colored roads based on speed limits or highlight specific areas based on sets of latitude and longitude coordinates.
Location Data, POI Maps, Spatial Data Visualization
Edit your location data in real-time
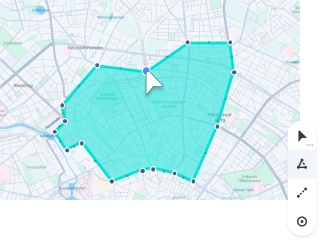
Explore and inspect your data with user-friendly tools. Add or remove lines, polygons and points of interest or modify the geometry and feature properties. All edits are published to your map in real-time.
Mapping Tools, Data Visualization Tools, Interactive Map Data Visualization
Build dashboards and applications
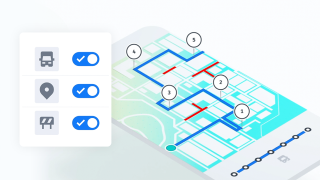
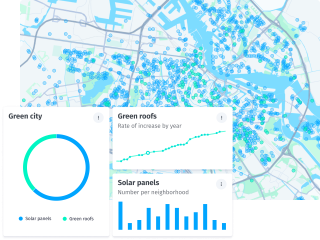
Manage your visualizations in easy-to-use dashboards. Layer, combine, filter and edit data instantly. Access visualizations that automatically update as the data streams come in.
Discover how HERE can help you gain insights from your data
Use world-class maps as your canvas
Get direct access to HERE's rich, accurate and up-to-date map content with global coverage.
Keep your data private and secure
Stay in control of your private environment by ensuring your data is secure. Remain in constant control of your data by working in a platform that is both data security and privacy certified by ISO/IEC 27001, SSAE SOC Type 2 and GDPR and CCPA compliant.
Extend and configure your work
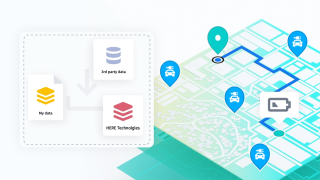
Enrich and enhance your spatial data and local expertise with HERE Location Services or external location data from HERE Marketplace.
Explore products and tools designed to visualize data
Start visualizing data
Create impactful map visualizations easily with data-driven styling and simple no-code/low-code tools.
See more ways our platform can help you
