Site Selection for EV Charging Stations using HERE EV Charge Points API and ArcGIS Pro

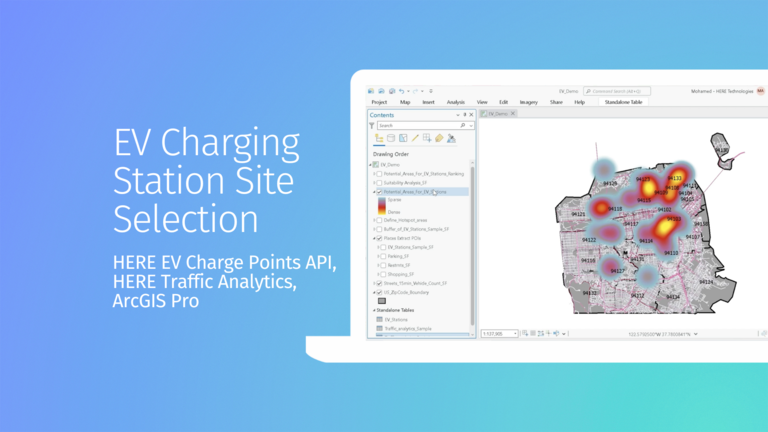
As we transition towards sustainable energy solutions, electric vehicles (EVs) are gaining more popularity. The widespread adoption of EVs has numerous benefits. However, a reliable EV charging infrastructure is essential for supporting the adoption and the use of electric vehicles. EV charging station site selection is a multi-faceted problem that involves various factors, such as traffic patterns, demand and supply of electricity, cost and availability of land, regulatory requirements, density of points of interest as restaurants, shopping, entertainment, and more. In this blog post, we will use HERE's authoritative Traffic Analytics data and existing EV Charge Points data to predict optimal placement of future EV charging stations. We will use ArcGIS Pro to process and visualize the data, and ArcGIS Business Analyst web to bring in some patterns.
Workflow
First, we will gather the required datasets:
a. HERE Traffic Analytics - historical data to find number of vehicles per zipcode
b. Zip codes shapefile - to provide analysis results at zip code level
c. Points of Interest (POIs) - for this sample, we will use parking lots, shopping malls, restaurants
d. HERE EV Charge Points - lists of existing charging stations with data on connector types, opening hours, and their location

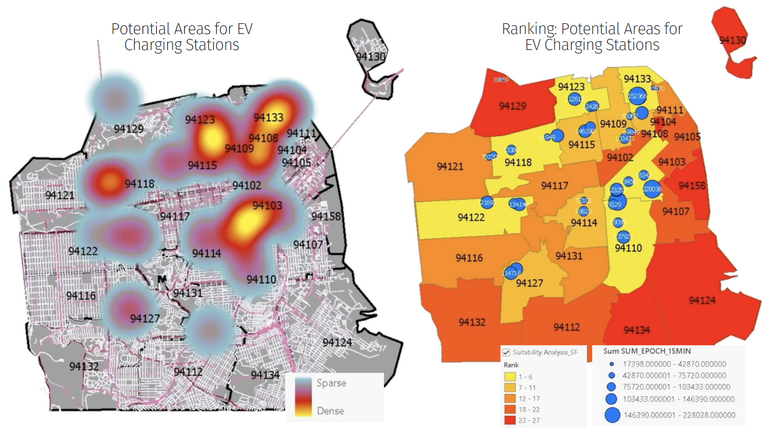
With Traffic Analytics data, we are able to find number of cars that have traveled a specific road segment. In this sample, we pulled data for one week. This data is summarized and symbolized on the top left screenshot. The top right screenshot shows the heatmap for above listed POIs and existing EV charging stations.

In the next step, we overlay three POI layers to create potential hotspot areas and a 100m buffer around it.
We create a spatial join of the Streets layer including the vehicle count with the POIs buffer. This provides us with prioritized ranking of zip codes optimal for placing new EV charging stations based on traffic analysis.

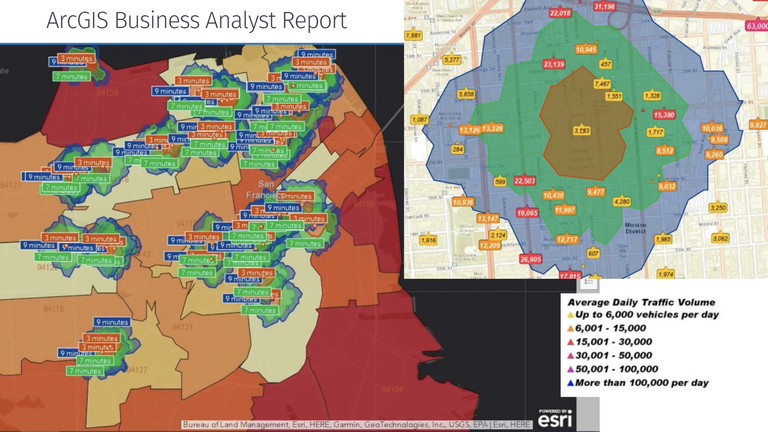
Taking this ranking to the ArcGIS Business Analyst web application, we use the Spending Power and Safety Score per zip code, and further refine the priority, ranking of our areas of interest. Next, we leverage ArcGIS Business Analyst to create 3, 7, 9 minute walking areas for each zip code. We get traffic and growth projections for various attributes such as education, entertainment, food & beverages, healthcare, recreation and more. These data points allow stakeholders to make informed decisions.
Collaboration Spotlight
Taking this a step further, we partnered with SAP and Esri to demonstrate an Intelligent Data Application which is solving for this real-world problem. By leveraging technologies such as Esri's ArcGIS Insights, HERE's data and APIs, and SAP HANA Cloud, GIS analysts can interact with spatial and data science features to find the best and worst locations for installing new charging stations, and ultimately supporting the expansion of EV charging infrastructure.
Have your say
Sign up for our newsletter
Why sign up:
- Latest offers and discounts
- Tailored content delivered weekly
- Exclusive events
- One click to unsubscribe


